Electric vehicle
(EV) charging network Blink Charging (NASDAQ: BLNK) stock has fallen (-37%) during the 2022 bear market. The EV charging operator and provider of charging equipment had impressive fiscal Q1 2022 metrics including a 339% increase in revenues and 346% increase in service revenues and a 99% increase in charging stations contracted or sold. However, these percentages can overstate the performance since the actual numbers are small like only $1.5 million in service revenues. The trajectory is still bullish as EV and electrification adoption are strong tailwinds with many giant automakers like Ford Motor (NYSE: F) moving to produce these vehicles in volume. Rising oil prices are also bolstering demand for EVs. EV sales are projected to have a compound annual growth rate (CAGR) of 24% from 2021 to 2030, according to the International Energy Agency. This is creating an immediate demand for EV charging infrastructure that can meet the need of over 120 EV charges annually by 2030. By comparison, there were only 2.8 million charges globally in 2021. The U.S. legislative environment for EVs is very favorable with the more than $7.5 billion in government allocation by the Biden administration to build a state-of-the-art EV charging infrastructure. Prudent investors seeking exposure to the EV charging infrastructure growth trend can look for opportunistic pullbacks in shares of Blink Charging.

MarketBeat.com – MarketBeat
Q1 Fiscal 2022 Earnings Release
On May 22, 2022, Blink reported its fiscal Q1 2022 results for the quarter ending March 2022. The Company reported earnings-per-share (EPS) loss of (-$0.36) versus consensus analyst estimates for a loss of (-$0.48), a $0.12 beat. Revenues grew 345.5% year-over-year (YoY) to $9.8 million, beating analyst estimates for $6.81 million. There was a 99% increase in charging stations contracted or sold Q1 2022 versus Q1 2021 with 3,174 charging stations contracted or sold in Q1 2022. Blink CEO Michael Farkas commented, “Our strong growth in the quarter stems primarily from our unique business model centered around providing flexible and fully integrated charging solutions to customers. As an owner-operator of many of our chargers, we’re intimately involved in every step of the installation process and can facilitate upgrades and other maintenance as needed to provide the best technology for the location while also benefiting from anticipated increased charging utilization. We have recently expanded our product offerings to include next-generation charging technology across the entire EV ecosystem including home, fleet, multifamily, retail, and federal highway infrastructure, enhancing our position as a technology innovator at the forefront of the EV charging industry.”
Conference Call Takeaways
CEO Farkas highlighted the Company’s growth driven by its solid platform, government awards, and overall EV adoption momentum. The Company contracted 3,174 commercial and residential charters, up 99% from the year ago quarter. The Company continues to win new grant and rebate awards including $3 million in the first quarter 2022 and $30 million since January of 2021. He commented, “The legislative environment surrounding the EV industry is incredibly favorable, and we believe we are positioned to win many more grants and rebates as federal, state and local governments allocate the $7.5 billion from the Biden administration for state-of-the-art EV charging infrastructure.” Blink acquired Electric Blue Charging to expand its European presence in the UK adding over 1,150 chargers installed or committed to delivery. This fits into Blink’s strategy to establish multi-year exclusive partnerships through acquisitions to increase its market reach, which has grown to over 19 countries.

BLNK Opportunistic Pullback Levels
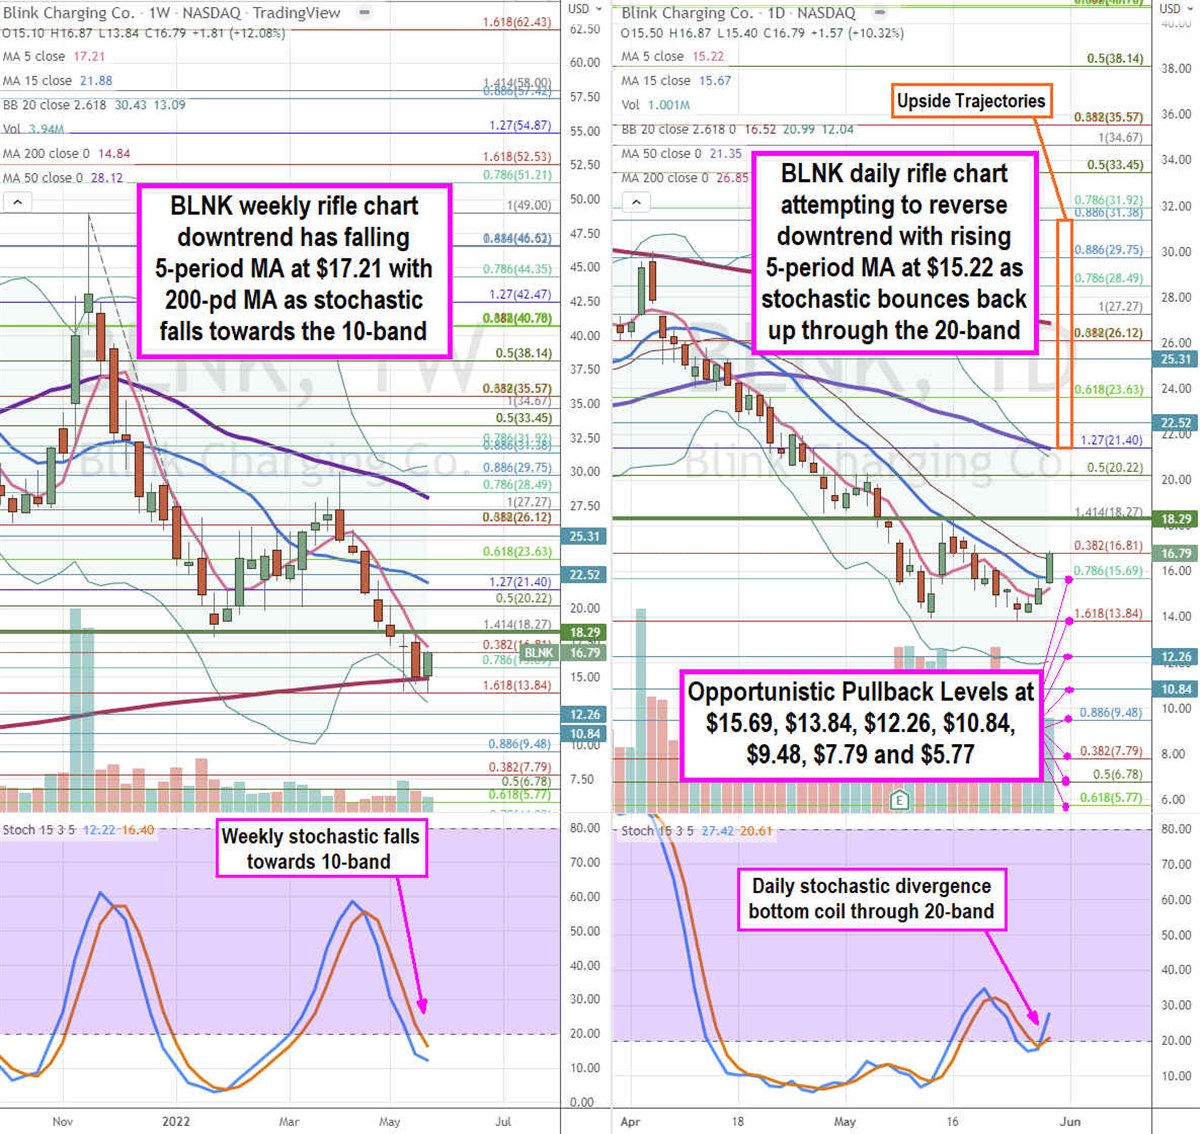
Using the rifle charts on the weekly and daily time frames provides the near-term perspective of the playing field for BLNK stock. The weekly rifle chart peaked near the $29.75 Fibonacci (fib) level. Shares collapsed to bottom out near the $13.84 fib before staging a recovery. The weekly rifle chart downtrend has a falling 5-period moving average (MA) resistance at $17.21 with 200-period MA support at $14.84 and lower weekly Bollinger Bands (BBs) at $13.09. The weekly 15-period MA continues to fall along with the 50-period MA at $28.12. The weekly stochastic has fallen under the 20-band and may form either a mini inverse pup through the 10-band or bounce on a cross up. The weekly market structure low (MSL) buy triggers above $18.29. The daily rifle chart downtrend stalled as it attempts a reversal on rising 5-period MA at $15.22 attempting to cross up through the 15-period MA at $15.67. The daily 50-period MA sits at $21.35 with upper daily BBs at $20.99. The daily stochastic has a divergence bottom as the stochastic bounces back up through the 20-band. Prudent investors can look for opportunistic pullbacks at the $15.69 fib, $13.84 fib, $12.26, $10.84, $8.48 fib, $7.79 fib, and the $5.77 fib level. Upside trajectories range from the $21.40 fib up towards the $31.38 fib level.
Credit: Source link

