Solar energy solutions provider First Solar (NASDAQ: FSLR) stock has fallen (-15%) for the year outperforming the Nasdaq bear market. The photovoltaic (PV) solar module maker saw significant drops in revenues stemming from a drop in modules sold and average selling price, and lower Japan project revenues. The Company is a solid benefactor in the global movement for clean energy sources and the adoption of renewable energy. Market sentiment has been slipping from inflationary pressures, geopolitical problems, supply chain disruptions and slow economic growth. The Company is looking ahead to 2023 looking for nearly $4 in EPS as bookings are very strong and exceeding 16.7 GW for the year. The Russian Ukraine conflict has pushed the European Union propose legislation to adopt renewable energy sources for half its power needs by 2030. This comes amid rising oil prices but also to move away from reliance on authoritarian states including Russian fossil fuels and cut gas consumption by 30%. This would require all new and existing energy performance D buildings to have rooftop solar installations. Prudent investors seeking exposure in a leader in the clean solar energy segment can look for opportunistic pullbacks in shares of First Solar.

MarketBeat.com – MarketBeat
Q1 Fiscal 2022 Earnings Release
On April 28, 2022, First Solar released fiscal Q1 2022 results for the quarter ending in March 2021. The Company reported an earnings per share (EPS) loss of (-$0.41) excluding non-recurring items, beating consensus analyst estimates for a loss of (-$0.44), by $0.03. Revenues fell (-54.1%) year-over-year (YoY) to $367 million, missing analyst estimates for $588.73 million. Year-to-date net bookings were 16.7 GW and record expected module shipment backlog grew over 35 GW. First Solar CEO Mark Widmar commented, “We are encouraged by our strong bookings progress, as we booked 11.9 GW in less than 60 days since the prior earnings call, bringing our year-to-date bookings total to 16.7 GW further setting ourselves up for 2023 and beyond. Our agile approach to contracting continues to attract customers looking for long-term certainty and value.”
Full-Year 2022 Mixed Guidance
First Solar raised its full-year fiscal 2022 earnings guidance with EPS ranging between $0.00 to $0.60 versus consensus analyst estimates for $1.93. Full-year fiscal 2022 revenues are estimated between $2.4 billion to $2.6 billion but still below consensus analyst estimates for $2.73 billion. The Company expects year-end 2022 cash balance in the range of $1.10 billion to $1.35 billion.
Conference Call Takeaways
CEO Widmar stated that the (-$0.41) loss in the quarter was expected and within internal expectations on the quarter. It’s reflective of the challenging 2022 environment. However, the bright spot is the pace of strong bookings including 11.9 GW in under 60 days. This brings the year-to-date bookings to 16.7 GW which sets up for a solid 2023 and beyond. The recent bookings include adjusters to increase ASPs based on achievements, technology road map, and sales risk share mitigation. He stated, “In short, while these contracts have a baseline ASP that is reflective of the value of the product, we are manufacturing today. That ASP has the potential to increase, to capture the value of our product or technology enhancements or to offset sales rate and aluminum margin erosion risk.” CEO Widmar is encouraged by the bilateral priority of the U.S. and E.U. in replacing energy dependency on authoritarian states. India serves as a model template as it’s expected to have 40 GW of new sales capacity and 50 GW of new modules capacity by 2025.
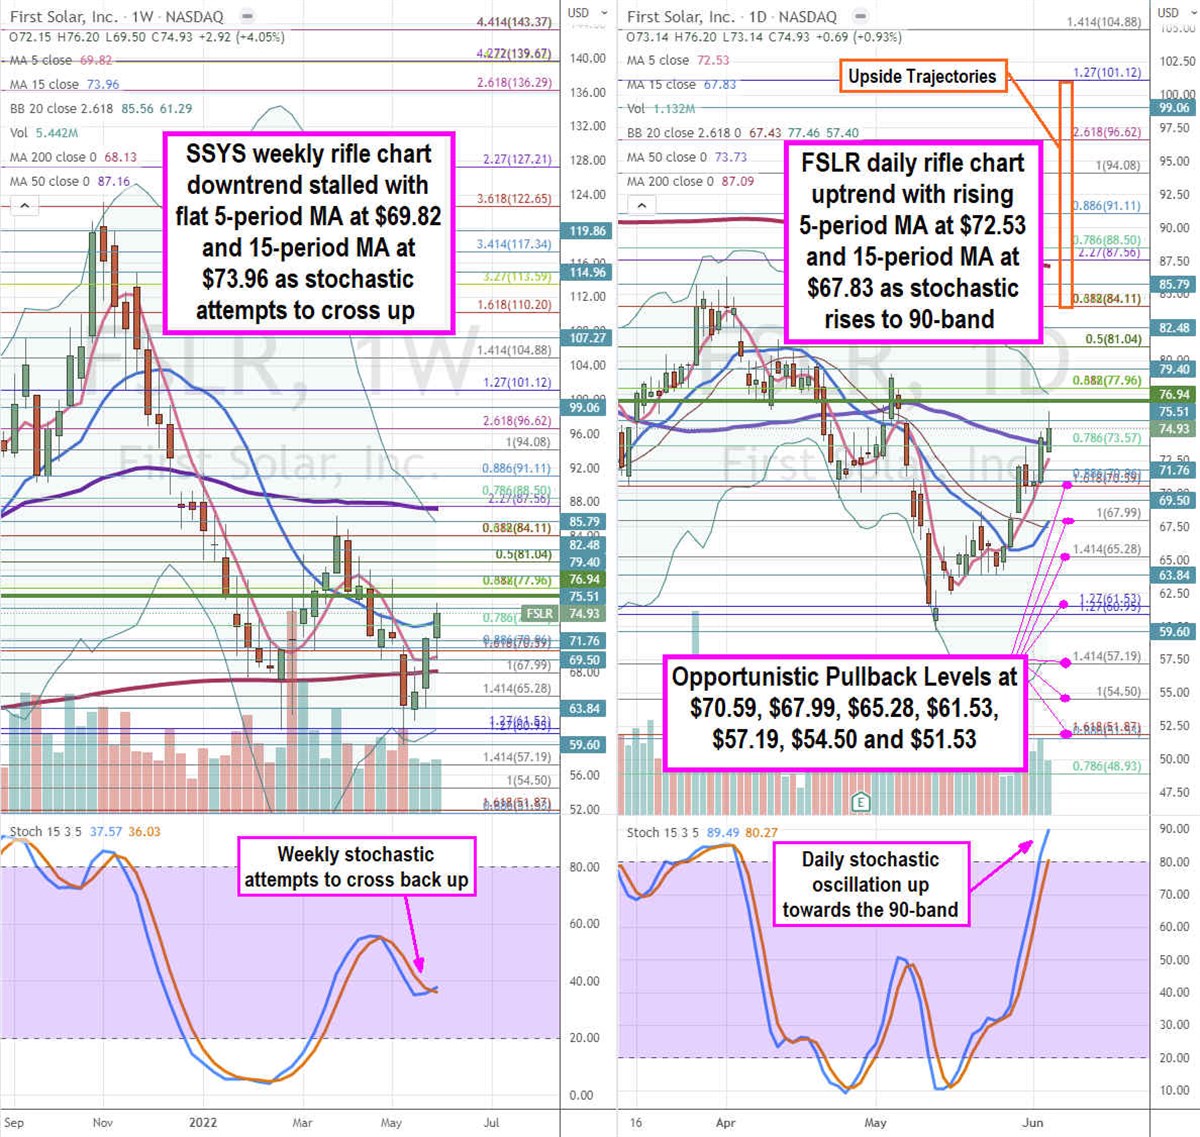

FSLR Opportunistic Pullback Levels
Using the rifle charts on weekly and daily time frames provides a precision view of the landscape for FSLR stock. The weekly rifle chart peaked out near the $122.65 Fibonacci (fib) level. The weekly downtrend stalled with a flattening 5-period moving average (MA) at $69.82 above the 200-period MA at $68.13 and rising 15-period MA at $73.96. The weekly 50-period MA sits at $87.16 above the weekly upper Bollinger Bands (BBs) at $61.29. The weekly stochastic is attempting to cross over back up to trigger a weekly market structure low (MSL) buy signal a breakout through $76.94. The daily rifle charts have staged a rally as the daily stochastic makes a full oscillation up towards the overbought 90-band. The daily 5-period MA is rising at $72.53 followed by the 15-period MA at $67.83. The daily upper BBs sit at $77.46, and the 50-period MA support sits at $73.73. The daily lower BBs sit at $57.40. Prudent investors can watch for opportunistic pullback levels at the $70.59 fib, $67.99 fib, $65.28 fib, $61.53 fib, $57.19 fib, $54.50 fib, and the $51.53 fib level. Upside trajectories range from the $84.11 fib up towards the $101.12 fib level.
Credit: Source link